
|
|
|
 |
 |
 |
|
EGG‑NEWS.com
Egg Industry News, Comments & More by
Simon M.Shane
|
|
 |
|
 |
|
 |
Egg Industry News
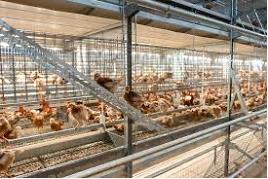
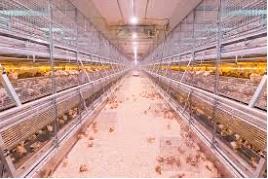
Big Dutchman Houses 200 million Hens in NATURA Aviary Systems
|
02/15/2026 |
|
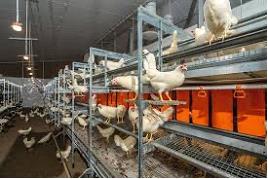
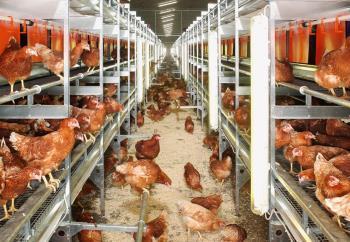
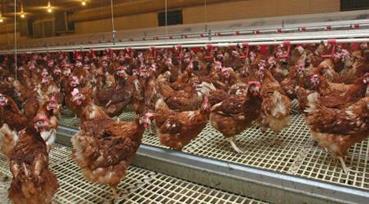
This edition of EGG-NEWS sponsored by Big Dutchman USA incorporates the announcement that NATURA aviaries now house 200 million hens worldwide. The achievement was recognized with a reception at the IPPE.
Monthly statistics and postings on current events of interest are provided for the benefit of subscribers. Comments and contributions are always welcome

|
Norway Extends Egg Shelf-Life to 35 Days
|
02/14/2026 |
|
 The Scientific Committee for Food and the Environment for Norway has extended shelf-life of table eggs to 35 days. This in contrast to the 28-day limit imposed by the EU. The European Food Safety Authority limit is based on models assuming vertical transmission of Salmonella Enteritis and subsequent multiplication of the pathogen within eggs stored at room temperature. The Scientific Committee for Food and the Environment for Norway has extended shelf-life of table eggs to 35 days. This in contrast to the 28-day limit imposed by the EU. The European Food Safety Authority limit is based on models assuming vertical transmission of Salmonella Enteritis and subsequent multiplication of the pathogen within eggs stored at room temperature.
The decision by Norway is based on the low prevalence of SE in laying flocks presumably  attributed to surveillance, biosecurity and vaccination. In addition and possibly more important, is the national mandate for a cold chain from packing through to point of sale as in the U.S. attributed to surveillance, biosecurity and vaccination. In addition and possibly more important, is the national mandate for a cold chain from packing through to point of sale as in the U.S.
Outbreaks of SE traced back to eggs are frequent in nations with a combination of warm summer temperatures and the absence of a cold chain as in Australia and in Eastern Europe.
|
Big Dutchman Marks 200 Million Hen Milestone for the NATURA® System
|
02/14/2026 |
|
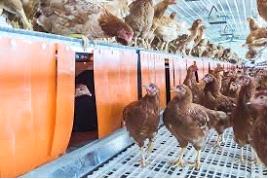
 During the 2016 IPPE, Big Dutchman announced that 200 million hens are now housed in NATURA® aviary systems worldwide. This achievement was attained following the installation of a NATURA® Step system at Forsman Farms. The threshold announced during the Expo was followed by a well-attended reception of loyal producers. Big Dutchman technical, sales and corporate representatives expressed thanks to farmers who have adopted and benefit from NATURA® systems in all egg producing nations. The NATURA® cage-free aviary models represent the culmination of 85-years of experience in housing egg-producing flocks. NATURA® systems offer optimal return on investment, a high standard of welfare, maintenance-free operation and a prolonged operating life. During the 2016 IPPE, Big Dutchman announced that 200 million hens are now housed in NATURA® aviary systems worldwide. This achievement was attained following the installation of a NATURA® Step system at Forsman Farms. The threshold announced during the Expo was followed by a well-attended reception of loyal producers. Big Dutchman technical, sales and corporate representatives expressed thanks to farmers who have adopted and benefit from NATURA® systems in all egg producing nations. The NATURA® cage-free aviary models represent the culmination of 85-years of experience in housing egg-producing flocks. NATURA® systems offer optimal return on investment, a high standard of welfare, maintenance-free operation and a prolonged operating life.
The NATURA® range comprises: -
- NATURA® Filia Rearing Aviary
This two-tier rearing aviary has an open design with ramps to encourage vertical movement within the system to establish balance and muscle development in pullets. This contributes to flock uniformity and matutity leading to early and high peak production after transfer to NATURA® laying aviaries.
Features include:-
- Feed and water are available on both tiers to eliminate competition.
- Sliding partitions are installed at five-foot intervals to facilitate placement, depletion and vaccination.
- The raised system extends the litter area available to the flock.
- The Filia system is provided with foldable approach perches to allow access to the tiers.
- The system is available in either 74” or 88” width.
- NATURA® Primus Rearing Aviary
 This three-tier rearing aviary is designed to ease the transition from rearing to laying housing. This three-tier rearing aviary is designed to ease the transition from rearing to laying housing.
Features include:-
- Feed and water are available on all tiers.
- Uniformity of temperature in the vertical and longitudinal planes is achieved through the design of the modules contributing to uniform distribution of chicks and pullets.
- NATURA® Visio Laying Aviary
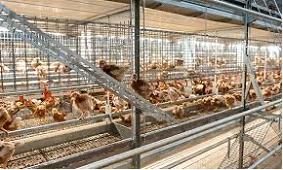 This two-tier open access aviary system is equipped with feed, watering and nests on each level. This two-tier open access aviary system is equipped with feed, watering and nests on each level.
Features include:-
- Dedicated areas for nesting, feeding and perching.
- The open design allows complete access to the floor area
- The step platforms allows hens to move vertically through the system with ease, allowing foraging, scratching, play and dust bathing conforming to welfare requirements.
- The Visio NATURA® aviary incorporates a twin belt design for egg collection allowing visibility and contributing to shell integrity and cleanliness.
- Hens can access nests from both sides of the system
- The attractive entrance to the nest reduces system-laid eggs.
- The height of the system allows retrofitting in existing buildings.
- NATURA® Step and Step XL Aviaries
 These three-tier installation represent a culmination of experience in optimizing return on investment from aviary-housed flocks. These three-tier installation represent a culmination of experience in optimizing return on investment from aviary-housed flocks.
Features include:-
- Upper and lower tiers equipped with chain feeding circuits.
- The middle tier incorporates two rows of Colony 2+ nests.
- The Step platforms allow hens to move vertically through the system.
- The Step concept includes dedicated areas for perching, feeding and laying.
- The completely open design conforms to the highest EU and U.S. standards allowing hens access to litter for natural behaviors.
The NATURA® Step aviary is available in two widths with the Step XL allowing up to 25 percent more usable house space than the NATURA® Step, depending on house configuration and dimensions.
- Colony 2+ Nest Installations
NATURA® aviary systems are equipped with the Colony2+ nest.
Features include: -
- Center-located egg belt with a short roll-out from the nest pad.
- The divided nest floor can be raised completely excluding hens from the nest.
- The plastic mat has molded fingers to protect shells from soiling and damage
- Solid nest pads prevent up-draft of air optimizing hen comfort.
The advantages offered by NATURA® rearing and laying aviaries have contributed to acceptance by producers as denoted by the 200 million milestone with more than 100 million hen places added over the past five years.
Further details on NATURA® aviaries are available at BigDutchmanUSA.com/egg production.
|
USDA-WASDE REPORT #668. February 11th 2026
|
02/11/2026 |
|
OVERVIEW

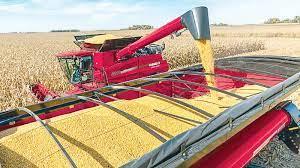
Understandably the February 11th edition of the World Agriculture Supply and Demand Estimates (WASDE) #668 projecting the 2026 season was little changed from the previous January 12th edition. Crop size and ending stocks were selected from previous harvest data, projections for domestic use and the effect of tariff policy and competition that influence export volumes
The February WASDE report projected that the 2026 corn crop will be harvested from an expanded 91.3 million acres, (90.0 million acres in 2025). The soybean crop will be harvested from an almost unchanged 80.4 million acres, (80.3 million acres in 2025).
The February WASDE yield value for the 2026 corn crop was held at 186.5 bushels per acre. By comparison corn yield was 183.1 bushels per acre in 2024. Soybean yield was retained at 53.0 bushels per acre, unchanged from 2025 reflecting previous harvests. By comparison soybean yield was 51.7 bushels per acre for the 2024 crop.
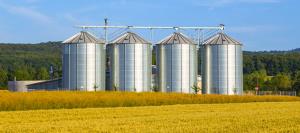
The February WASDE projection for the 2026 ending stock of corn was lowered by100 million bushels 4.5 percent) from January to 2,127 million bushels. The February USDA projection for the 2026 ending stock of soybeans was unchanged from January at 350 million bushels consistent with domestic use and export projections.
The February WASDE retained the projected corn price for the 2026-2027 market year to an average of 410 cents per bushel. The projected average season price for soybeans was held at 1,020 cents per bushel. The price of soybean meal was unchanged at $295 per ton.
USDA commodity prices suggest rising feed costs for livestock and poultry producers given projections for yields, domestic use and the prospect of increased exports. In some areas return from corn will be below break-even given relative yields, production costs and depressed per bushel prices. The USDA has announced a “bridging” allocation of $12 billion to row-crop farmers to compensate for prolonged low commodity prices resulting from reduced exports occasioned by tariffs imposed by the U.S.
Projections for world output included in the February 2026 WASDE report, reflect the most recent estimates for the production and export of commodities especially in the Southern Hemisphere with an emphasis on volumes and prices offered by Argentine and Brazil. Economists also consider the impact of weather patterns arising from Southern Oscillation events especially on these nations and their neighbors.
It is accepted that USDA projections for exports will be influenced by the fluid situation relating to tariffs. Estimates of exports are also based on the perceived intentions and needs of China. This Nation sharply curtailed purchases of commodities and especially U.S. soybeans since the 2024-2025 market year extending into the current year.
CORN
 Production parameters for corn were unchanged from the January WASDE, reflecting the predicted yield, and updated projections for domestic use and trade. The February WASDE Report projected a 2026 crop of 17,021 million bushels, compared to 16,752 million bushels for the previous 2025 record harvest. The “Feed and Residual” category was unchanged for 2026 at 6,200 million bushels. The Food and Seed category was projected at 1,370 million bushels. The Ethanol and Byproducts Category was retained at 5,600 million bushels consistent with estimated demand for E-10 and higher blends for driving needs during winter months. Projected corn exports were raised to 3,300 million bushels, based on recent orders and shipments. The anticipated ending stock of corn will be down 100 million bushels to 2,127 million bushels or 11.4 percent of projected availability. Production parameters for corn were unchanged from the January WASDE, reflecting the predicted yield, and updated projections for domestic use and trade. The February WASDE Report projected a 2026 crop of 17,021 million bushels, compared to 16,752 million bushels for the previous 2025 record harvest. The “Feed and Residual” category was unchanged for 2026 at 6,200 million bushels. The Food and Seed category was projected at 1,370 million bushels. The Ethanol and Byproducts Category was retained at 5,600 million bushels consistent with estimated demand for E-10 and higher blends for driving needs during winter months. Projected corn exports were raised to 3,300 million bushels, based on recent orders and shipments. The anticipated ending stock of corn will be down 100 million bushels to 2,127 million bushels or 11.4 percent of projected availability.
The forecast USDA average season farm price for corn in the WASDE report was 410 cents per bushel. At close of trading after the noon February 11th release of the WASDE, the CME spot price for corn was 429 cents per bushel, 4.6 percent above the USDA projection and 1.9 percent above the January 12th CME price.
FEBRUARY 2026 WASDE #668 Summary for the 2025 Corn Harvest:
|
Harvest Area
|
91.3 million acres
|
(98.8 m. acres planted, with harvest corresponding to 92.4% of acres planted)
|
|
Yield
|
186.5 bushels per acre
|
(Updated from 186.0 bushels per acre in the Dec. WASDE)
|
|
Beginning Stocks
|
1,551 m. bushels
|
|
|
Production
|
17,021 m. bushels
|
|
|
Imports
|
25 m. bushels
|
|
|
Total Supply
|
18,597 m. bushels
|
Proportion of Supply
|
|
Feed & Residual
|
6,200 m. bushels
|
33.3%
|
|
Food & Seed
|
1,370 m bushels
|
7.4%
|
|
Ethanol & Byproducts
|
5,600 m. bushels
|
30.1%
|
|
Domestic Use
|
13,170 m. bushels
|
70.8%
|
|
Exports
|
3,300 m. bushels
|
17.8%
|
|
Ending Stocks
|
2,127 m. bushels
|
11.4%
|
Average Farm Price: 410 cents per bushel. (Unchanged from the January WASDE)
SOYBEANS
 Projections for soybeans were retained from the January WASDE to reflect the 2026 crop. Yield of 53.0 bushels per acre was held but with an area of 81.2 million acres planted compared to 2025. The February WASDE retained the projection for the 2026 soybean crop at 4,262 million bushels. Crush volume was held at 2,570 million bushels consistent with anticipated demand and industry capacity. Projected exports were retained at 1,575 million bushels despite the prospect of increased imports by China following uncertainty over tariffs and diplomatic conflict. Ending stocks were anticipated to be 350 million bushels. Prior to 2018, China, the largest trading partner for U.S. agricultural commodities, imported the equivalent of 25 percent of U.S. soybeans harvested. Projections for soybeans were retained from the January WASDE to reflect the 2026 crop. Yield of 53.0 bushels per acre was held but with an area of 81.2 million acres planted compared to 2025. The February WASDE retained the projection for the 2026 soybean crop at 4,262 million bushels. Crush volume was held at 2,570 million bushels consistent with anticipated demand and industry capacity. Projected exports were retained at 1,575 million bushels despite the prospect of increased imports by China following uncertainty over tariffs and diplomatic conflict. Ending stocks were anticipated to be 350 million bushels. Prior to 2018, China, the largest trading partner for U.S. agricultural commodities, imported the equivalent of 25 percent of U.S. soybeans harvested.
The January USDA projection for the ex-farm seasonal price for soybeans was held at 1,020 cents per bushel. At close of trading on February 11th following the noon release of the WASDE, the CME spot price was 1,129 cents per bushel, 1.7 percent above the February USDA projection and 7.5 percent above the January 12th CME price, reflecting prospects of higher exports.
FEBRUARY 2026 WASDE #668 Summary for the 2026 Soybean Harvest:-
|
Harvest Area
|
80.4 million acres
|
81.2 m. acres planted. Harvest corresponding to 99.0% of planted acreage)
|
|
Yield
|
53.0 bushels per acre
|
(Updated from 53.5 bushels/acre in the September WASDE)
|
|
Beginning Stocks
|
325 m. bushels
|
|
|
Production
|
4,262 m. bushels
|
|
|
Imports
|
20 m. bushels
|
|
|
Total Supply
|
4,607 m. bushels
|
Proportion of Supply
|
|
Crush Volume
|
2,570 m. bushels
|
55.8%
|
|
Exports
|
1,575 m. bushels
|
34.2%
|
|
Seed
|
73 m. bushels
|
1.6%
|
|
Residual
|
39 m. bushels
|
0.8%
|
|
Total Use
|
4,257 m. bushels
|
92.4%
|
|
Ending Stocks
|
350 m. bushels
|
7.6%
|
Average Farm Price: 1,020 cents per bushel. (Unchanged from the January WASDE)
SOYBEAN MEAL
 The projected parameters for soybean meal were unchanged from the January WASDE. Production will be up to 60.8 million tons, consistent with the retained soybean crush volume of 2,570 million bushels. Projected production reflects the stagnant demand for biodiesel despite expanded U.S. crushing capacity. Crush volume is driven both by exports and domestic consumption for livestock feed and for soy oil supplying the food and biodiesel segments. The projection of domestic use was 42.0 million tons. Exports were estimated at 19.4 million tons. The projected parameters for soybean meal were unchanged from the January WASDE. Production will be up to 60.8 million tons, consistent with the retained soybean crush volume of 2,570 million bushels. Projected production reflects the stagnant demand for biodiesel despite expanded U.S. crushing capacity. Crush volume is driven both by exports and domestic consumption for livestock feed and for soy oil supplying the food and biodiesel segments. The projection of domestic use was 42.0 million tons. Exports were estimated at 19.4 million tons.
The USDA projected the ex-plant price of soybean meal at $295 per ton, unchanged from the January WASDE as an average for the season based on supply and demand considerations. USDA predicted an ending stock of 450,000 tons representing 0.7 percent of supply.
At close of trading on January 12th the CME spot price for soybean meal was $298 per ton, up $3 per ton (1.0 percent) compared to the USDA projection of $295 per ton and down 1.0 percent from the December 9th CME price.
FEBRUARY 2026 WASDE #668 Projection of Soybean Meal Production and Use
Quantities in thousand short tons
|
Beginning Stocks
|
398
|
|
Production
|
60,752
|
|
Imports
|
725
|
|
Total Supply
|
61,875
|
|
Domestic Use
|
42,025
|
|
Exports
|
19,400
|
|
Total Use
|
61,425
|
|
Ending Stocks
|
450
|
Average Price ex plant:$295 per ton (Unchanged from the January WASDE)
IMPLICATIONS FOR PRODUCTION COST
The price projections based on CME quotations for corn and soybeans suggest higher feed production costs for broilers and eggs. Going forward, prices of commodities will be determined by World supply and demand and U.S. domestic use and exports.
For each 10 cents per bushel change in corn:-
- The cost of egg production would change by 0.45 cent per dozen
- The cost of broiler production would change by 0.25 cent per live pound
For each $10 per ton change in the cost of soybean meal:-
- The cost of egg production would change by 0.35 cent per doze
- The cost of broiler production would change by 0.30 cent per live pound.
WORLD SITUATION
With respect to world coarse grains and oilseeds the February 2026 WASDE Report included the following appraisals by USDA:-
COARSE GRAINS:
 “Global coarse grain production for 2025/26 is virtually unchanged at 1.590 billion tons. The 2025/26 foreign coarse grain supply and use outlook is essentially unchanged relative to last month. Foreign corn production is down fractionally as a decline for Mexico is mostly offset by an increase for the EU. Barley production is raised for Argentina but lowered for Turkey”. “Global coarse grain production for 2025/26 is virtually unchanged at 1.590 billion tons. The 2025/26 foreign coarse grain supply and use outlook is essentially unchanged relative to last month. Foreign corn production is down fractionally as a decline for Mexico is mostly offset by an increase for the EU. Barley production is raised for Argentina but lowered for Turkey”.
“Corn exports for 2025/26 are raised for the United States but lowered for Ukraine. Corn imports are higher for Iran, Mexico, Turkey, Lebanon, and Vietnam but lowered for the EU. Barley exports are raised for Argentina and Russia. Foreign corn ending stocks are higher reflecting increases for Ukraine and Iran partly offset by a decline for Mexico. Global corn stocks, at 289.0 million tons, are down 1.9 million”.
OILSEEDS:
“Global 2025/26 soybean supply and use forecasts include increased production, crush, and ending stocks. Production for Brazil is raised 2.0 million tons to 180.0 million on higher area and yield, reflecting beneficial weather throughout the season and state-level reporting. Production for Paraguay is increased 0.5 million tons to 11.5 million on favorable rainfall over the season”.
“Soybean crush is raised for Brazil and Paraguay driven by higher global soybean meal demand, particularly for the EU based on import pace to date. Similar to the United States, growth in EU oilseed meal demand grew substantially in 2024/25 due to competitive prices. In 2025/26, the growth is expected to moderate with a higher share of rapeseed meal given the recovery of the crop this marketing year.
China is reported to be considering buying more U.S. soybeans. Global soybean import demand is nearly unchanged from last month, so therefore if China bought more from the United States, global soybean exports will likely be shifted with more U.S. shipments to China and less to other markets”.
‘Global soybean ending stocks are increased 1.1 million tons to 125.5 million on higher stocks for Brazil. Another notable revision is higher 2025/26 palm oil production for Malaysia, up 0.5 million tons to 20.2 million”.
World and U.S. Data Combined for Coarse Grains and Oilseeds:-
|
Factor: Million m. tons
|
Coarse Grains
|
Oilseeds
|
|
Output
|
1,590*
|
696
|
|
Supply
|
1,913
|
838
|
|
World Trade
|
252
|
215
|
|
Use
|
1,594
|
580
|
|
Ending Stocks
|
320
|
146
|
*Values rounded to one million metric ton
(1 metric ton corn= 39.37 bushels. 1 metric ton of soybeans = 36.74 bushels)
(“ton” represents 2,000 pounds)
|
REVIEW OF JANUARY 2025 EGG PRODUCTION COSTS.
|
02/10/2026 |
|
This update of U.S egg-production costs and available prices is provided for the information of producers and stakeholders. Statistical data was unavailable for October and November due to the Federal shutdown. Most January figures are now available and included in this edition.
JANUARY HIGHLIGHTS
- January 2025 USDA ex-farm blended USDA nest-run, benchmark price for conventional eggs from caged hens was 52 cents per dozen, down 70 cents per dozen or 57.3 percent from the December 2025 value of 122 cents per dozen. The corresponding January2024 and 2025 values were respectively $1.72 and $5.82 cents per dozen. For annual comparison, average monthly USDA benchmark price over 2023 was 146 cents per dozen compared to 247 cents per dozen covering 2024. Stock levels and prices prior to the onset of flock depletions due to HPAI indicated a relative seasonal balance between supply and demand. Future nest-run and wholesale prices will be largely dependent on consumer demand for shell eggs and products, as determined by the economy, supply as influenced by flock placements, incidence of HPAI, net exports and the rate of replacement of depopulated pullets and hens and planned depletion. Other considerations include diversion to shell sales from the egg-breaking sector in an interconnected industry.
- Imports of shell eggs continued during the first three quarters of 2025 but with the cumulative negative trade balance attaining 19.9 million dozen shell-equivalents through October. During November the positive trade balance in shell-eggs amounted to 0.3 million dozen. For 2025 through November, U.S. liquid and dried products combined achieved a positive trade balance of 26.3 million case-equivalents with November rising to 10.5 million dozen shell-egg equivalents attributed to shipment of dried egg products mainly to the EU.
- January 2025 USDA ex-farm negotiated USDA nest-run, benchmark price for all categories of cage-free eggs was 63 cents per dozen. The December 2025 value was 110 cents per dozen. The corresponding January 2024 and 2025 values were respectively 380 and 809 cents per dozen.
- Fluctuation in wholesale price is attributed in part to the amplification of upward and downward swings associated with the commercial benchmark price-discovery system in use. An important factor influencing pricing is the proportion of shell eggs supplied under cost-plus contracts. A high proportion of available eggs in this category accentuates the upward and downward price trajectory of uncommitted eggs as determined by the price discovery system. Extreme fluctuation is exemplified by high prices prevailing during the 1st quarter of 2025 and low values during December 2025 and 2026 to date. The magnitude of price fluctuation is inconsistent with relatively small changes in production as flocks are replaced or changes in demand.
- The response to highly pathogenic avian influenza as distorted by the price discovery system was the major driver of prices in 2024 and through 2025 due to the high seasonal incidence rates. Approximately 40 million hens and at least 2.0 million pullets were depleted in 2024 with close to an additional 45 million birds, (hens and pullets) in both large complexes and contract farms through 2025. The Fall 2025 losses involved complexes of 3.1 million hens in late September and 2.0 million in early October. During November 570,000 hens producing table eggs were depopulated on 22 farms in close geographic proximity with flock losses averaging 24,000 per event. This suggested the vulnerability of contract producers of cage free eggs with common risk factors including feed supply and egg collection. This situation is a departure from losses involving a few very large complexes evident in the wave of cases during early fall months. This said in January 2.8 million hens among a few large farms occurred followed by the depopulation of 2.2 million hens in Lancaster County, PA in early February.
- January 2025 USDA average nest-run production cost for conventional eggs from caged flocks over four regions (excluding SW and West), applying updated inputs was 75.5 cents per dozen, up 0.7 cents from December 2025 at 75.5 cents per dozen as influenced by feed cost. The December average nest run production cost for other than caged and certified organic hens was estimated by the EIC to be 96.0 cents per dozen up 0.9 cents per dozen from December. Approximately 60 cents per dozen should be added to the USDA benchmark nest-run costs to cover processing, packing material and transport to establish a realistic cost value as delivered to warehouses.
- January 2026 USDA benchmark nest-run margin for conventional eggs attained a negative value of 24.2 cents per dozen compared to a positive margin of 116.5 cents per dozen in December 2025. For 2025 the average monthly nest-run production margin attained 172 cents per dozen. Average nest-run monthly margin for 2024 was 170.8 cents per dozen compared to 64.2 cents per dozen in 2023 and 155 cents in 2022.
- January 2026 USDA benchmark nest-run margin for all categories of cage-free eggs was a negative 33.0 cents per dozen compared to a positive margin of 14.9 cents per dozen in December 2025. For 2025 the average monthly nest-run production margin attained 293 cents per dozen. Average nest-run monthly margin over 2024 was 440 cents per dozen compared with 100 cents per dozen in 2023, a year with a relatively low incidence rate of HPAI compared to the preceding and following years.
- The December 2025 national flock (over 30,000 hens per farm) was stated by the USDA to be up by 3.7 million hens (rounded, and a probable undercount) to 293.8 million compared to 290.1 in December. There were approximately 326 million hens before the advent of the H5N1 epornitic in 2022. Approximately 3.5 million hens returned to production from molt during the month together with projected maturation of 26 million pullets, with the total offset by depletion of an unknown number of spent hens. On February 4th USDA estimated the total U.S table-egg production flock at 302.0 million with 296.2 million hens actually in production.
- December 2025 pullet chick hatch of 26.3 million was up 0.3 million, (0.3 percent) from November, inconsistent with an increased industry need to replace depopulated flocks.
- November export data is reviewed in a companion article in this edition. In November 2025 exports of shell-eggs and products combined were up 6.2 percent from October 2025 to 487,800 case equivalents representing the theoretical production of 7.2 million hens. Shell egg exports were down 53.1 percent from October totaling 76,000 cases. Exports were dominated by Canada (45 percent of volume) and the “Rest of Americas” including the Caribbean (46 percent). With respect to 411,000 case-equivalents of egg products, up 38.0 percent from the prior month, importers comprised the E.U (61 percent of volume), Canada (2 percent), “Rest of Americas and the EU (7 percent), Japan, (14 percent), Mexico, (4 percent) collectively representing 90 percent of shipments. Volumes exported are based on the needs of importers, competing suppliers, availability in the U.S. and FOB prices offered.
- For 2025 through November the positive trade balance in all shell and derived egg products attained 6.8 million dozen shell equivalents.
 |
TABLES SHOWING KEY PARAMETERS FOR JANUARY 2026.
Summary tables for the latest USDA January 2026 costs and unit prices were made available by the EIC on February 10th 2025. Data is arranged, summarized, tabulated and compared with values from the previous January 16th 2025 release reflecting December 2025 costs and production data, as revised and applicable. Monthly comparisons of production data and costs are based on revised USDA and EIC releases.
VOLUMES OF PRODUCTION REFLECTING THE ENTIRE INDUSTRY
|
PARAMETER
|
JANUARY 2026
|
DECEMBER 2025
|
|
Table-strain eggs in incubators
|
53.1 million (Jan.)
|
52.7 million (Dec.)
|
|
Pullet chicks hatched
|
26.3 million (Dec.)
|
26.0 million (Nov.)
|
|
Pullets to be housed 5 months after hatch
|
23.7 million (May ‘26)
|
23.5 million (Apr. ’26)
|
|
EIC December 1st 2026 U.S. total flock projection
|
324.0 million (Feb.)
|
316.0 million (Jan. ‘26)
|
|
National Flock in farms over 30,000
|
293.8 million (Dec.)
|
291.2 million (Nov.)
|
|
National egg-producing flock
|
307.0 million (Dec.)
|
304.0 million (Nov.)
|
|
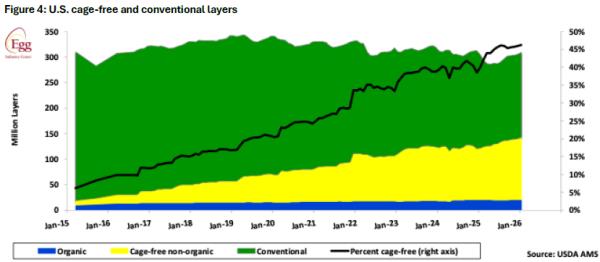
Cage-free flock excluding organic
Cage-free organic flock
|
121.8 million (Jan.)
21.0 million (Jan.)
|
120.1 million (Dec.)
20.3 million (Dec.)
|
|
Proportion of flocks post-molt
|
10.9% (Dec.)
|
10.7% (Nov.)
|
|
Total of hens in National flock, 1st cycle (estimate)
|
271.5 million (Dec.)
|
267.3 million (Nov.)
|
 |
|
Total U.S. Eggs produced (billion)
|
7.82 December 2025
|
7.49 November 2025
|
|
Total Cage-Free hens in production
Proportion of organic population
|
142.8 million (Jan.)
14.2% Organic
|
140.4 million (Dec.)
14.9% Organic
|
|
“Top-9” States hen population (USDA)1
|
177.3 million (Jan.)
|
188.4 million (Nov.)
|
*Source USDA/EIC Note 1. Texas excluded to maintain confidentiality
PROPORTION OF U.S. TOTAL HENS BY STATE, 2025
Based on a nominal denominator of 295 million hens in flocks over 30,000 covering 95 percent of the U.S complement.
USDA has amended inclusion of specific states in regions and eliminated Texas data to protect confidentiality relating to sizes of Company flocks
|
STATE
|
December1
2025
|
November
2025
|
|
Iowa
|
15.2%
|
14.5 %
|
|
Indiana
|
12.0%
|
11.8 %
|
|
Ohio
|
12.9%
|
12.3 %
|
|
Pennsylvania
|
7.8%
|
7.6 %
|
|
Texas (estimate)
|
5.0% ?
|
4.8 %?
|
|
CA MO UT CO2
|
9.6
|
10.1 %
|
- Values rounded to 0.1%
- MO, 4.7%; CA , 2.2%; CO, 2.2%; CO, 1%.
Rate of Lay, weighted hen-month (USDA) 82.2% December 2025. 81.8 % November 2025
*Revised USDA
|
Actual per capita
|
Egg consumption 2020
|
285.6 (down 7.8 eggs from 2019)
|
|
Actual per capita
|
Egg consumption 2021
|
282.5 (down 3.1 eggs from 2020)
|
|
Actual per capita
|
Egg consumption 2022
|
280.5 (down 2.0 eggs from 2021 due to HPAI)
|
|
Actual per capita
|
Egg consumption 2023
|
278.0 (down 2.5 eggs from 2022)
|
|
Actual per capita
Revised per capita
Projection per capita
|
Egg consumption 2024
Egg consumption 2025
Egg consumption 2026
|
270.6 (down 7.2 eggs from 2023) attributed to HPAI losses*
259.2 (down 11.4 eggs from 2024) forecast adjusted for HPAI losses , was 261.1 last month but this was aspirational
273.7 (up 14.5 eggs from 2025 assuming restoration of flocks and without HPAI losses)
|
*Revised, using data from USDA Livestock, Dairy and Poultry Outlook January 16th 2026 taking into account demand from the food service sector and presumably including the effect of HPAI depopulation and net importation.
EGG INVENTORIES AT BEGINNING OF JANUARY 2026:
|
Shell Eggs
|
1.95 million cases in January 2026 up 9.0 percent from December 2025
|
|
Frozen Egg
Products
|
588,278 case equivalents, up 13.1 percent from December 2025
|
|
Dried Egg
Products
|
Not disclosed since March 2020 following market disruption due
To COVID. Moderate levels of inventory are assumed.
|
EGGS BROKEN UNDER FSIS INSPECTION (MILLION CASES) December 2025, 6.50 November 2025, 6.61
|
Cumulative eggs broken under FSIS inspection 2024 (million cases)
|
77.2
|
JAN. TO DEC.
|
|
Cumulative 2024: number of cases produced (million)
|
257.9
|
JAN. TO DEC.
|
|
Cumulative 2024: proportion of total eggs broken
|
29.9%
|
(30.8% 2022)
|
| |
|
|
|
Cumulative eggs broken under FSIS inspection 2025 (million cases)
|
79.4
|
JAN.-DEC.
|
|
Cumulative 2025: number of cases produced (million)
|
245.5
|
JAN.-DEC.
|
|
Cumulative 2025: proportion of total eggs broken
|
32.3%
|
JAN.-DEC.
|
EXPORTS NOVEMBER 2025: (Expressed as shell-equivalent cases of 360 eggs).
|
Parameter
|
Quantity Exported
|
|
Exports:
|
October 2025. November 2025
|
|
Shell Eggs (thousand cases)
|
162. 76
|
|
Products (thousand case-equivalents)
|
297. 411
|
|
TOTAL (thousand case equivalents)*
|
459. 487
|
*Representing 2.0 percent of National production in November 2025 comprising 16% shell, 84% products.
COSTS AND UNIT REVENUE VALUES1 FOR CONVENTIONAL EGGS FROM CAGED HENS
|
Parameter
|
JANUARY 2026
|
DECEMBER 2025
|
|
4-Region Cost of Production ex farm (1st Cycle)1
|
76.2 c/doz
|
75.5 c/doz
|
|
Low
|
74.0c/doz (MW)
|
73.4 c/doz (MW)
|
|
High
|
78.7 c/doz (NE)
|
77.9c/doz (NE)
|
Notes: 1. Excludes SW and West representing an important deficiency
Components of Production cost per dozen:-
| |
JANUARY 2026
|
DECEMBER 2025
|
|
Feed
|
34.5 c/doz
|
34.9c/doz
|
|
Pullet depreciation
|
12.2 c/doz
|
11.9c/doz
|
|
Labor (estimate),
|
|
|
|
Housing (estimate),
|
29.5c/doz
|
28.7c/doz
|
|
Miscellaneous and other (adjusted Jan. 2026)
|
|
|
Ex Farm Margin (rounded to nearest cent) according to USDA values reflecting January 2026:-
52.0 cents per dozen1- 76.2 cents per dozen = -24.2 cents per dozen (December 2025 comparison: 122.0 cents per dozen – 75.5 cents per dozen = 46.5 cents per dozen.
Note 1: USDA Blended nest-run egg price
| |
|
JANUARY 2026
|
DECEMBER 2025
|
|
USDA
|
Ex-farm Price (Large, White)
|
52.0 c/doz (Jan.)
|
122.0 c/doz (Dec.)
|
| |
Warehouse/Dist. Center
|
96.0 c/doz (Jan.)
|
174.0 c/doz (Dec.)
|
| |
Store delivered (estimate)
|
101.0 c/doz (Jan.)
|
179.0 c/doz (Dec.)
|
| |
Dept. Commerce Retail1 National
|
271.0 c/doz (Dec.)
|
286.0 c/doz (Nov.)
|
| |
Dept. Commerce Retail1 Midwest
|
N/A. (Dec.)
|
N/A (Nov.)
|
- Unrealistic USDA values based on advertised promotional prices with few participating stores, non-representative of shelf prices!
| |
JANUARY 2026
|
DECEMBER 2025
|
|
U.S. Av Feed Cost per ton
|
$222.97
|
$225.36
|
|
Low Cost – Midwest
|
$201.36
|
$203.73
|
|
High Cost – West
|
$260.42
|
$263.73
|
|
Differential
Corn/ton 5 regions
Soybean meal/ton 5 regions
|
$ 59.06
$172.26
$319.14
|
$ 60.00
$174.42
$326.65
|
|
Pullet Cost 19 Weeks
|
$4.74 JANUARY 2026
|
$4.65 DECEMBER 2025
|
|
Pullet Cost 16 Weeks
|
$4.18 JANUARY 2026
|
$4.10 DECEMBER 2025
|
AVERAGE COSTS AND UNIT REVENUE FOR EGGS FROM CAGE-FREE HENS
|
Parameter
|
JANUARY 2026
|
DECEMBER 2025
|
|
5-Region Cost of Production ex farm (1st Cycle)
|
96.0 c/doz
|
95.1 c/doz
|
|
Low
|
91.7c/doz (MW)
|
90.7 c/doz (MW)
|
|
High
|
103.5 c/doz (West)
|
102.8 c/doz (West)
|
Components of Production cost for cage-free eggs, per dozen:-
| |
JANUARY 2026
|
DECEMBER 2025
|
|
Feed (non-organic)
|
39.9 c/doz
|
40.2 c/doz
|
|
Pullet depreciation
|
16.1 c/doz
|
15.8 c/doz
|
|
Labor (estimate) plus
|
|
|
|
Housing (estimate) plus
|
40.0c/doz
|
39.1 c/doz
|
|
Miscellaneous and other
|
|
|
Ex Farm Margin (rounded to cent) according to USDA values reflecting negotiated price for January 2026:-
Cage-Free brown 63.0 cents per dozen1- 96.0 cents per dozen =-33.0 cents per dozen
December 2025:-110.0 cents per dozen1- 95.1 cents per dozen = +14.9 cents per dozen
| |
|
JANUARY 2026
|
DECEMBER 2025
|
|
USDA
|
USDA Average Ex-farm Price1
Gradable nest run2
|
173 c/doz (Jan.)
63 c/doz. (Jan.)
|
173 c/doz (Dec .)
110 c/doz. (Dec.)
|
| |
Warehouse/Dist. Center3
|
c/doz (Jan.)
|
c/doz (Dec.)
|
| |
Store delivered (estimate)
|
c/doz (Jan.)
|
c/doz (Dec.)
|
| |
Dept. Com. Retail4 C-F White
Dept. Com. Retail4 C-F Brown
|
254 c/doz (Jan.)
345 c/doz (Jan.)
|
263 c/doz (Dec.)
343 c/doz (Dec.)
|
| |
Dept. Com. Retail3 Organic
Dept. Com. Retail3 Pasture
|
503 c/doz (Jan.)
644 c/doz (Jan.)
|
573 c/doz (Dec.)
664 c/doz. (Dec.)
|
Contract price, nest-run loose. Range 155 to 210 c/doz. Negligible change since July 2024 and totally unrealistic.- Negotiated price, loose. Range $0.34 to $1.10 per dozen
- Estimate based on prevailing costs
- Unrealistic USDA values based on promotional prices with few participating stores and non-representative of shelf prices
|
Cage-Free* Pullet Cost 19 Weeks
|
$5.76 NOVEMBER 2025
|
$5.60 DECEMBER 2025
|
|
Cage-Free* Pullet Cost 16 Weeks
|
$5.04 NOVEMBER 2025
|
$4.94 DECEMBER 2025
|
* Conventional (non-organic) feed
Feed prices used are the average national and regional values for caged flocks. Excludes organic feeds with prices substantially higher than conventional.
|
Poultry Welfare Alliance Established at IPPE
|
02/10/2026 |
|
 The International Poultry Welfare Alliance (IPWA) established a partnership with the International Egg Foundation (IEF) at the 2026 International Production and Processing Expo (IPPE). The objective is to intensify training and support for poultry welfare. The Memorandum of Understanding allows for IPWA to assist the IEF with standards and guides. The International Poultry Welfare Alliance (IPWA) established a partnership with the International Egg Foundation (IEF) at the 2026 International Production and Processing Expo (IPPE). The objective is to intensify training and support for poultry welfare. The Memorandum of Understanding allows for IPWA to assist the IEF with standards and guides.
 Bruce Dooyema, Chairman of the IEF stated, “Through our partnership with IPWA we can apply proven welfare tools in the field while contributing farmer-led insights that help ensure guidance reflecting real-world conditions.” Bruce Dooyema, Chairman of the IEF stated, “Through our partnership with IPWA we can apply proven welfare tools in the field while contributing farmer-led insights that help ensure guidance reflecting real-world conditions.”
Dr. Katy Tarrant, Chair of IPWA stated, “We are honored to support the IEF mission and to learn from the regions where these solutions matter most.”
 The Memorandum of Agreement presumes coordination between the organizations to assist field outcomes and identify opportunities to modify training in welfare and application of science to improve the standards of housing and management on a global basis. The Memorandum of Agreement presumes coordination between the organizations to assist field outcomes and identify opportunities to modify training in welfare and application of science to improve the standards of housing and management on a global basis.
|
FDA Reports on 2025 Egg-Farm Registrations
|
02/08/2026 |
|
 The FDA categorizes egg production farms as “small” with 3,000 to 50,000 hens or “large” with more than 50,000 hens. Using this broad but uninformative classification there were 749 new registrations with 634 small farms and 115 large farms in 2025. Although small farms are increasing in number there is proportionality with respect to large farm registrations. In 2021 the ratio of small to large farms was 5.8: 1 with 183 registrations. For the most recent year the ratio was 5.5: 1 with 749 registrations. The FDA categorizes egg production farms as “small” with 3,000 to 50,000 hens or “large” with more than 50,000 hens. Using this broad but uninformative classification there were 749 new registrations with 634 small farms and 115 large farms in 2025. Although small farms are increasing in number there is proportionality with respect to large farm registrations. In 2021 the ratio of small to large farms was 5.8: 1 with 183 registrations. For the most recent year the ratio was 5.5: 1 with 749 registrations.
The data presented by FDA at the United Egg Producers’ Food Safety Committee on January 26th may be important with respect to assessing demand for inspection services, but the figures are totally meaningless in the context of industry trends and expansion. The classifications of “small” and “large” are far too narrow and should be expanded in relation to hen numbers within each of the existing two categories. A second question relates to the number of total registrations that have increased since 2021 representing a three-fold expansion, without corresponding to the total number of hens. Of particular interest is the increase in small farms from 2024 with a total of 329 units representing five million hens at a hypothetical 15,000 birds per registrant. It is also noted that large farms increased by 115 registrations. Assuming a minimum of 50,000 hens per farm this would represent 5.58 million additional birds.
FDA data confirmed that as of January 2026 there were 4,605 registered farms located in the United States with 3,612 or 78.4 percent classified as small producers. The figures presented do not apparently distinguish between pullet farms and egg production units. Data is, however, consistent with the increase in farms ranging from 10,000 to 20,000 hens established by contract farmers supplying egg packing plants with cage-free, free-range and pasture-housed flocks.
During Calendar 2025, the FDA in collaboration with state agencies conducted 244 inspections or 5.3 percent of all farms to determine compliance with federal standards for food safety. Of the 244 inspections ten required official action with six warning letters. If this proportion reflects the entire U.S. industry there are theoretically 120 farms that would have qualified for an official warning.
There is no indication of the number of farms with less than 3,000 hens that fly under FDA radar. A unit with of 3,000 hens producing at 75 percent hen-day, could theoretically market 68,000 dozen, representing a potential risk for up to 3,000 consumers or more if restaurants are recipients of contaminated eggs.
Fortunately, epidemiologic data confirms a low incidence rate of Salmonella Enteritidis infection from eggs in the U.S. This is attributed in part to widespread adoption of vaccination, an effective modality not considered by the FDA in framing the Final Rule on Salmonella in Eggs. Thorough cooking to 165 F for 30 seconds to the center of the yolk effectively destroys vertically transmitted Salmonella Enteritidis. Mandatory washing of eggs with approved detergent-disinfectant combinations at an appropriate pH and temperature to destroy shell contamination and the post-packing cold chain are modalities contributing to the low incidence rate of egg-borne salmonellosis.
|
USPOULTRY Releases Initial 2026 IPPE Statistics In
|
02/08/2026 |
|
 In a January 29th release, USPOULTRY the co-sponsor of the 2026 International Production and Processing Expo (IPPE) noted 33,000 registered attendees, 663,000 square feet of exhibit space and 1,385 exhibitors representing records in all three categories. The co-organizers noted, “ In a January 29th release, USPOULTRY the co-sponsor of the 2026 International Production and Processing Expo (IPPE) noted 33,000 registered attendees, 663,000 square feet of exhibit space and 1,385 exhibitors representing records in all three categories. The co-organizers noted, “ despite the weather-related challenges we are really excited about the efforts attendees and exhibitors made to attend IPPE this week.” despite the weather-related challenges we are really excited about the efforts attendees and exhibitors made to attend IPPE this week.”
In addition to the show floor, there were more than 80 hours of education sessions dealing with sustainability, food safety, industry trends, the International Poultry Scientific Forum, the Latin American Poultry Summit and TECHTalk Program and the new-product showcase.
Due to inclement weather covering a broad swath of the U.S., actual attendance especially in the exhibition halls was lower than registrants according to contacts. Is it not time to consider changing the timing of the IPPE consistent with the ation taken by the Midwest Poultry Federation with PEAK?

In 2027 the IPPE will take place from January 26 to 28 in the Georgia World Conference Center.
|
Administration Suing Michigan Over Cage-Free Requirement
|
02/06/2026 |
|
 The Federal government has filed a lawsuit against the Michigan Department of Agriculture and Rural Development and the State Attorney General over restrictions relating to cage-free housing. In 2019 the legislature of the state revised the Animal Industry Act to ban the sale of eggs from hens confined to conventional cages. The law, duly enacted went into effect at the beginning of 2025 following a six-year transition during which producers The Federal government has filed a lawsuit against the Michigan Department of Agriculture and Rural Development and the State Attorney General over restrictions relating to cage-free housing. In 2019 the legislature of the state revised the Animal Industry Act to ban the sale of eggs from hens confined to conventional cages. The law, duly enacted went into effect at the beginning of 2025 following a six-year transition during which producers  invested capital in alternatives systems of housing. invested capital in alternatives systems of housing.
Nancy Barr Executive Director of Michigan Allied Poultry Industries commented, “Our producers are ready, they have spent a lot of time and money getting there but they are committed to cage-free housing.”
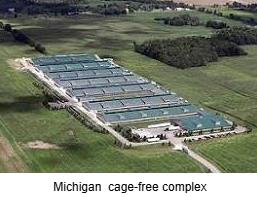 The legal action by the Administration would appear to be moot since conversion is a reality and the lawsuit would appear to be a politically inspired action The legal action by the Administration would appear to be moot since conversion is a reality and the lawsuit would appear to be a politically inspired action
|
Value of Early Detection of HPAI in Effluent Questioned
|
02/06/2026 |
|
 Barnwell Bio has justifiably acquired venture capital funding to detect a range of human and avian pathogens in effluent. The company presented their ability to conduct metagenomic bio-surveillance at the 2026 IPPE. Effluent assay technology has acquired enhanced sensitivity and specificity over the past decade and especially since the advent of COVID, representing an important adjunct to public health. In our industry there are obvious beneficial applications arising from early detection of poultry diseases to enable rapid imposition of quarantines or to initiate therapy if available. Barnwell Bio has justifiably acquired venture capital funding to detect a range of human and avian pathogens in effluent. The company presented their ability to conduct metagenomic bio-surveillance at the 2026 IPPE. Effluent assay technology has acquired enhanced sensitivity and specificity over the past decade and especially since the advent of COVID, representing an important adjunct to public health. In our industry there are obvious beneficial applications arising from early detection of poultry diseases to enable rapid imposition of quarantines or to initiate therapy if available.
Barnwell Bio surveillance has been used successfully to detect cases of bacterial infections that can be treated expeditiously to reduce losses. The question arises whether the time interval between detection of a pathogen in effluent as compared to conventional diagnostic procedures provides a demonstrable and quantifiable benefit.
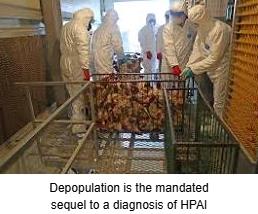
It is of concern that the company is promoting the concept of their early detection system to detect and hence control highly pathogenic avian influenza. Since diagnosis of this infection results in mandatory depopulation with appropriate WOAH procedures including quarantine and area surveillance, the justification for application of this technology is questioned. The critical 24 hours between early recognition using “microbiome fingerprinting” and widely applied PCR assay motivated by flock records, clinical evaluation and rapid immunoassay may or may not provide any practical or financial benefit. It is highly probable that a presumptive HPAI positive on an effluent assay would require confirmation by PCR before official federal and state action is taken. As yet Barnwell has not quantified the lead time to diagnose HPAI in large egg production complexes or turkey growing farms, so the claims for benefits are theoretical and as yet unsubstantiated. Even with a 24-to-48-hour lead time, the end result will inevitably be depopulation in the event of HPAI. The only advantage with respect to early recognition of HPAI could be prevention of inter-farm infection within companies operating multiple complexes with biological interconnection.
On a regional public health level research has shown a time-related association betweenand outbreaks of HPAI in poultry and wild birds and detection of H5 in wastewater*.The authors concluded that "Scaled wastewater surveillance is a proactive tool in monitoring and managing future outbreaks"-presumably in human populations.
Obvious benefits are evident with regard to some bacterial diseases that can be treated applying approved antibiotic therapy or even in cases of viral erosive diseases to anticipate secondary bacterial infection. Claims relating to prevention or control of HPAIon specific complexes appear speculative at this time.
* Wolfe, M.K. et al Wastewater surveillance for avian influenza: National patterns of detection and relationship with reotyed outbreaks and infections. Rxiv doi.org.10.1101/2025.05.06.35327 100
|
Trade in Shell Eggs and Products, January through November 2025
|
02/06/2026 |
|
 The volume of exports of shell eggs and products is conditioned by the domestic needs of importers, price against competitors and regulatory disease and logistic restraints. Imports into the U.S. are determined by domestic needs with reduced supply due to flock depopulation as the principal driving factor during the first nine months of 2025. The volume of exports of shell eggs and products is conditioned by the domestic needs of importers, price against competitors and regulatory disease and logistic restraints. Imports into the U.S. are determined by domestic needs with reduced supply due to flock depopulation as the principal driving factor during the first nine months of 2025.
USAPEEC data reflecting volume of exports for shell eggs and egg products are shown in the table below comparing 2024 with 2025:-
|
PRODUCT
|
Jan.-Nov. 2024
|
Jan.-Nov. 2025
|
Difference
|
|
Shell Eggs
|
|
|
|
|
Volume (m. dozen)
|
75.9
|
60.4*
|
-15.5 (-20.4%)
|
|
Value ($ million)
|
177.5
|
250.0
|
+72.5 (+40.8%)
|
|
Unit Value ($/dozen)
|
2.34
|
4.14
|
+1.80 (+76.9%)
|
|
Egg Products
|
|
|
|
|
Volume (metric tons)
|
23,065
|
19,810
|
-3,255 (-14.1%)
|
|
Value ($ million)
|
105.8
|
103.0
|
-2.8 (-2.7%)
|
|
Unit Value ($/metric ton)
|
4,587
|
5,199
|
+612 (+13.3%)
|
U.S. EXPORTS OF SHELL EGG AND EGG PRODUCTS DURING
JANUARY-NOVEMBER INCLUSIVE IN 2025 COMPARED WITH 2024
*The data published by USDA for shell eggs are slightly different from USAPEEC figures included in this table.
 For the eleven-month period Canada was the export destination of 69.7 percent of U.S. shell eggs followed by the Caribbean at 19.9 percent. For egg products the four major importers collectively comprised 79.0 percent of volume with the relative proportions represented by Japan (29.4%); EU, (19.6%); Mexico, (16.1%) and Canada, (15.7%), For the eleven-month period Canada was the export destination of 69.7 percent of U.S. shell eggs followed by the Caribbean at 19.9 percent. For egg products the four major importers collectively comprised 79.0 percent of volume with the relative proportions represented by Japan (29.4%); EU, (19.6%); Mexico, (16.1%) and Canada, (15.7%),
According to the USDA Egg Markets Overview, February 6th, shell eggs exported over 11 months attained 52.3 million dozen. This represents the average production of 2.6 million hens or 0.9 percent of the current population of producing hens. All egg products including liquid and dried, attained 66.7 million dozen shell equivalents for a total of 119.0 million dozen shell equivalents over eleven months. Imports over the same period comprised 71.9 million dozen shell eggs for breaking and 40.3 million dozen shell egg equivalents over all product forms for a total of 112.2 million dozen shell equivalents
Net positive trade was therefore 6.8 million dozen shell equivalents
The trade situation during 2026 will be influenced by the needs of importers as influenced by HPAI, an erratic tariff situation, landed price and availability. Since supply has increased in volume with a sharp decrease in domestic price, imports will be curtailed with an expectation of higher exports consistent with a more competitive situation.
|
Failure of Retailers to Remove Recalled Product from Shelves
|
02/04/2026 |
|

Bill Marler, a prominent plaintiffs’ attorney with considerable experience in aspects of food safety, noted that containers of ByHeart infant formula are still on the shelves of some supermarkets months after the November 11th 2025 recall. The brand was implicated in an outbreak of infant botulism involving 51 confirmed cases in 19 states.
The recall was justified by demonstrating that the Cl. botulinum Type A in isolates from patients was identical to isolates from product applying whole genome sequencing assay. Further studies implicate organic milk powder, an ingredient in the formula, as the source of contamination.
The FDA should be more aggressive in enforcing recalls, especially since public health is concerned. By the same token retailers should immediately comply with recall notices and remove product to limit exposure to pathogens and foreign material.
|

 |
|
USDA Cage-Free Production Data for January 2026
|
02/03/2026 |
|
The USDA Cage-Free Report covering January 2026, was released on February 2nd 2026.
The report documented the complement of hens producing under the Certified Organic Program to be 21.0 million (rounded to 0.1 million), up 70,000 hens or 0.3 percent from December 2025. The number of hens classified as cage-free (but excluding Certified Organic) and comprising aviary, barn and other systems of housing apparently increased by 2.2 million hens or 1.9 percent from December 2025 to 121.8 million, attributed to expansion, transition from conventional cages and repopulation of depleted flocks.
Extensive depopulation was carried out as a result of HPAI through January and February 2025 (31 million), but with lower intensity in March (0.2 million) and April (1.0 million) and a single large complex in Arizona during May (3.8 million). Losses reemerged during late September in a caged-bird complex in Wisconsin (3.1 million hens and 250,000 pullets). Additional depopulations occurred in October, (2.2 million); November, 0.5 million; December, (0.2 million); January (1.5 million) and February (1.4 million).
Average weekly production for Certified Organic eggs in January 2026 was up 1.0 percent percent (rounded) compared to December 2025 with a high average weekly production of 83.9 percent. Average weekly flock production for cage-free flocks other than Certified Organic was up 2.5 percent in January 2026, with a high average hen-month production of 82.6 percent. Seasonally placed flocks in anticipation of periods of peak demand increase the availability of cage-free and organic eggs, reflecting pullet chick placements 20 weeks previously.
There is no adequate explanation for the elevated production rates recorded other than the high proportion of young hens reaching peak placed in anticipation of December demand. It is also assumed that almost all cage free flocks are in the first cycle of production with negligible molting contributing to the high average in hen-week values compared to caged hens.
The categorization of U.S. flocks according to housing system for January was unavailable among the assumed 295 million producing hens. The breakdown will be provided when data is released.
Losses attributed to HPAI in 2025 comprised:-
Caged flocks, 24.8 million representing 8.4 percent of a nominal 290 million producing hens
Cage-free flocks, 17.6 million representing 5.9 percent of the national flock
Organic flocks, negligible, >0.1 percent
|
Average Flock Size
(million hens)
|
Average
January 2025
|
*Average
Q3- 2025
|
Average
Q2- 2025
|
Average
Q1 –
2025
|
Average
Q4 –
2024
|
Average
Q3-
2024
|
|
Certified Organic
|
21.0
|
20.0
|
20.0
|
20.4
|
20.5
|
20.0
|
|
Cage-Free Hens
|
121.8
|
115.6
|
108.4
|
103.4
|
104.5
|
103.9
|
|
Total Non-Caged
|
142.8
|
135.6
|
128.4
|
123.8
|
125.0
|
123.9
|
*October and November data was not released to compile Q4 average
|
Average Weekly Production (cases of 360 eggs)
|
December
2025
|
January
2026
|
|
Certified Organic @ 83.3% hen/day
|
338,683
|
341,966 +1.0%
|
|
Cage-Free @ 82.1% hen/day
|
1,908,273
|
1,955,847 +2.5%
|
|
All Non-Caged @ 82.3% hen/day
|
2,246,956
|
2,297,813 +2.3%
|
On January 2nd 2026 USDA recorded the following National inventory levels expressed in 30-dozen cases (rounded) with the change from December 2025 as a percentage of the total quantity of eggs:-
Commodity shell eggs of all sizes. 1,395,000. (-3.0%)
Commodity breaking stock. 360,800. (-0.4%)
Specialty eggs. 32,400. (+4.9%)
Certified organic eggs. 81,100. (-4.5%)
Cage-Free eggs 438,600. (-1.1%) equivalent to 1.6 days production
|
Average Nest Run Contract Price Cage-Free
White and Brown combined for January 2026
|
$1.73/doz.* (unchanged from May 2025)
|
|
January 2025 Range:
|
$1.55 to $2.10/doz. (unchanged from May 2025)
|
|
FOB Negotiated January price, grade-ready quality, loose nest-run. Price range $0.34 to $1.10 per dozen
|
Average January 2026 Value of $0.63/doz. ($1.10/doz. December 2025)
|
*Essentially a meaningless value
|
Average January 2026 advertisedpromotional National Retail Price C-F, Large Brown
|
$3.45/doz. Jan. 2025 (5 regions)
(Was $3.43/doz. In December 2025)
|
|
USDA Based on 5 ‘Lower 48’ Regions, 937 stores
SW, NW, NE, MW & SC.
|
Range $1.99/doz. (NW) to $4.08/doz. (MW)
|
Negotiated nest-run grade-ready cage-free price for January 2026 averaged $0.43 per dozen, down $0.45 per dozen (-51.7 percent) from $0.88 per dozen in December 2025, reflecting a disturbance in balance between demand and supply.
The January 2026 advertised U.S. featured retail price for Large White cage-free eggs over 1,429 ‘Lower 48’ stores in five regions (NW, NE, SW, MW and SC.) was $2.54 per dozen. This compares with 1,657 stores featuring cage-free Large White in December and reflects fewer promotions as the year has progressed, consistent with lower demand and increased production. The January 2026 advertised U.S. featured retail price for Large Brown cage-free eggs over 957 stores in five regions was $3.45 per dozen with a range of $1.99 per dozen in the NW region to $4.08 per dozen in the MW region. The average promotional shelf price was only 2 cents per dozen above December 2025 for this category
The recorded average gradeable nest run price of $0.43 per dozen for brown and white cage-free combined plus a provision of $0.60 cents per dozen for packaging, packing and transport, resulted in a theoretical price of $1.03 per dozen delivered to CDs. The average advertised promotional retail prices of $3.45 per dozen for Brown and $1.46 per dozen for white represented retail margins of 235 percent for featured Brown and 146 percent for White respectively. Fewer promotions were offered for Brown compared to White-shelled cage-free by stores reflecting the balance between supply and demand for the two broad categories. Margins are presumed higher for non-featured eggs including pastured and other specialty eggs at shelf prices attaining in excess of $8.00 per dozen in high-end supermarket chains. Retailers are maximizing margins especially on Certified Organic, free-range and pastured categories restricting the volumes of sales, of all categories ultimately disadvantageous to producers and consumers.
|
Sad Passing of Dr. Stanley Kleven
|
02/02/2026 |
|
 Funeral services for the late Dr. Stanley Herbert Kleven were held on Friday January 23rd. Dr. Kleven, born June 24, 1940 was associated throughout his career with the University of Georgia Poultry Disease Research Center. Funeral services for the late Dr. Stanley Herbert Kleven were held on Friday January 23rd. Dr. Kleven, born June 24, 1940 was associated throughout his career with the University of Georgia Poultry Disease Research Center.
He was recognized as an international expert in avian mycoplasmosis including detection and control of Mg and Ms. He was the co-author of over 200 peer-reviewed articles and served as a major professor for 17 doctoral-level graduates and a larger number of students earning the Masters degree.
Over his distinguished career Dr. Kleven provided leadership in the American Veterinary Medical Association, the American Association of Avian Pathologists, the World Veterinary Poultry Association and the National Poultry Improvement Association. He received the AAAP Special Service Award in 2002 and was inaugural inductee in the Hall of Honor in 2016.
He will be sadly missed for his scientific acumen, collegiality, mentorship and contributions to the industry.
|
Private Label Sales Outpace National Brands
|
02/02/2026 |
|
 According to a report sponsored by the Private Label Manufacturers Association by market research company Circana, dollar sales for private label products attained $282 billion in calendar 2025. This was a 3.3 percent increase over the previous year and compares to the growth in national brands of 1.2 percent. According to a report sponsored by the Private Label Manufacturers Association by market research company Circana, dollar sales for private label products attained $282 billion in calendar 2025. This was a 3.3 percent increase over the previous year and compares to the growth in national brands of 1.2 percent.
Unit sales of private label brands grew 0.6 percent. In contrast, national brand unit sales fell by an equivalent amount. The segment with the highest dollar sales among private label products comprised refrigerated items with a 6.1 percent increase followed by beverages at 4.8 percent, frozen items that increased by 2.4 percent and general foods at 1.6 percent.

Peggy Davies, president of the Private Label Manufacturers Association noted a shift in consumer priorities primary based on cost and availability with an appreciation by consumers that private label products offer equivalent quality and health properties compared to national brands.
Notwithstanding the growth in private brands, Eggland’s Best continues to grow in both sales volume and maintains price in a fluctuating market for generic eggs. This is based on substantiated nutritional claims, with health implications and supported by a marketing program incorporating mainstream and social media.
|
USPOULTRY Annual Awards
|
02/02/2026 |
|
 During the USPOULTRY chairman's reception at the 2026 International Poultry Expo Awards were presented for service to the industry:- During the USPOULTRY chairman's reception at the 2026 International Poultry Expo Awards were presented for service to the industry:-
USPOULTRY Workhorse of The Year
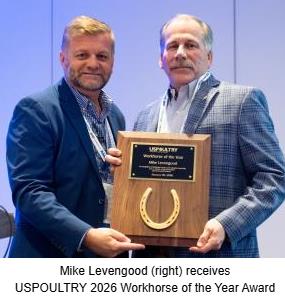
- Mike Levengood, VP Animal Care Officer and Farmer Relationship Advocate at Perdue Farms was named Workhorse of the Year.
Nath Morris president of USPOULTRY noted, “It is great honor to present this distinguished award to Mike in recognition of his dedicated service to the both the poultry and egg industries and USPOULTRY.” Morris added, “Mike has made a lasting and meaningful impact on both the industry and our association.”
|
|
USPOULTRY Lamplighter Awards:

- Joel Brandenberg, retired president of the National Turkey Federation for expanding marketing effort, strengthening export partnerships benefiting turkey producers and processors.
- Bill Kinross publisher of Food Processing and Meeting Place
- Kim Rice of Rose Acre Farms with responsibilities for food safety, regulatory compliance and laboratory operations.
- Dr. Angie Siemens a food safety expert and consultant with numerous industry responsibilities with producers including Smithfield Foods and Oscar Meyer.
|
|

- Gwen Venable Executive VP of Expo and Communication Services for USPOULTRY and the driver for the Poultry Expo. She is active in strategic communication marketing and public relations.
- Dr. Jeanna Wilson affiliated with the University of Georgia, Department of Poultry Science is an internationally recognized specialist in broiler breeder management and aspects of flock production and incubation.
|
|
Commenting on the recipients of the 2026 Lamplighter Awards, Jonathan Cade of Hy-Line International and outgoing president of USPOULTRY noted, “The dedication to service of this year’s Lamplighter Award recipients has been invaluable in driving the poultry industry forward. We value their contribution and we sincerely appreciate their service to the industry.”
|
|
|
|
|
View More
|
Top
|
|