REVIEW OF JANUARY 2021 EGG PRODUCTION COSTS AND STATISTICS.
HIGHLIGHTS
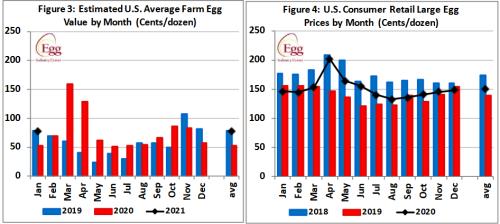
- January 2021 USDA ex-farm blended nest-run benchmark price was 76.8 cents per dozen, 33.7 percent higher than the December 2020 value of 57.4 cents per dozen. The average monthly USDA benchmark ex-farm price for 2020 was 76.5 cents per dozen with a range of 52.9 cents per dozen in January to 159.7 cents per dozen in March. The downward price trend from early May through July was attributed to restoration of normal consumer purchasing patterns coupled with diversion of eggs from breaking to the shell-egg market. Currently stock levels and prices indicate relative balance between supply and demand with seasonal prices attributable to moderate over-production and continued diversion from the egg-breaking sector.
- January 2021 USDA average nest-run production cost was 2.1 cents per dozen higher than in December 2020 at 70.3 cents per dozen mainly due to feed cost. A downward adjustment of 2.5 cents in fixed and miscellaneous costs was introduced for January 2021 by the EIC invalidating direct comparison with December 2020.
- January 2021 USDA benchmark nest-run margin attained a positive value of 6.5 cents per dozen compared to a negative margin of 10.4 cents per dozen in December 2020, subject to the adjustment as noted above.
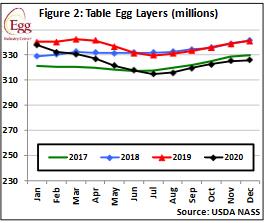
- December 2020 national flock in production (over 30,000 hens/farm) was up 0.7 million hens or 0.2 percent to 310.3 million. There are approximately 3.4 million hens due to return to production from molt offset by depletion of older flocks.
- December 2020 pullet chick hatch was up 11.1 percent or 2.6 million from November 2020 to 26.7 million.
- December 2020 export of shell eggs and products combined was up 36.6 percent from November 2020 to 878,100 case equivalents representing the theoretical production of 12.7 million hens. Exports of shell eggs and products attained 914,400 case equivalents in 2020 up 8.1 percent from 2019.
INTRODUCTION.
Summary tables for the latest USDA January 2021 prices and flock statistics made available by the EIC on February 22nd 2021 are arranged, summarized, tabulated and reviewed in comparison with values from the previous January 8th 2021 posting reflecting December 2020 cost and production data.
COSTS & REVENUE
|
Parameter
|
JANUARY 2021
|
DECEMBER 2020
|
|
5-Region Cost of Production ex farm (1st Cycle)
|
70.3 c/doz
|
68.2 c/doz
|
|
Low
|
67.1 c/doz (MW)
|
64.0c/doz (MW)
|
|
High
|
75.1c/doz (NWest)
|
97.7c/doz (CA)
|
Components of USDA 6-Region 1stCycle nest-run Cost of Production:-
|
JANUARY 2021
|
DECEMBER 2020
|
|
Feed
|
42.4 c/doz
|
37.9c/doz
|
|
Pullet depreciation
|
12.1 c/doz
|
12.0 c/doz
|
|
Labor (estimate)
|
4.0 c/doz
|
4.0 c/doz
|
|
Housing (estimate)
|
5.0 c/doz
|
5.0 c/doz
|
|
Miscellaneous and other*
|
6.8 c/doz
|
9.3 c/doz
|
* Adjusted January 2021 and used as a rounding factor
Ex Farm Margin (rounded to nearest cent) according to USDA values reflecting JANUARY 2021:-
76.8 cents per dozen1- 70.3 cents per dozen = +6.5 cents per dozen
(December 2020 comparison 57.41 cents per dozen – 68.2 cents per dozen = -10.8 cents per dozen.)
Note 1: USDA Blended egg price
|
JANUARY 2021
|
DECEMBER 2020
|
|
USDA
|
Ex-farm Price (Large, White)
|
76.8 c/doz (Jan.)
|
57.4 c/doz (Dec.)
|
|
Cage-free to packing plant
|
193.0 c/doz (Jan.)
|
138.0 c/doz (Dec.)
|
|
Warehouse/Dist. Center
|
105.0 c/doz (Jan.)
|
87.0 c/doz (Dec.)
|
|
Store delivered (estimate)
|
110.0 c/doz (Jan.)
|
92.0 c/doz (Dec)
|
|
Dept. Commerce Retail
|
148.1 c/doz (Dec.)
|
145.0 c/doz (Nov.)
|
|
Layer Feed Cost
|
JANUARY 2021
|
DECEMBER 2020
|
|
See note on source of data: now USDA
U.S. Average
|
$265.20/ton
|
$241.48/ton
|
|
High
|
$290.30/ton (N.West)
|
$289.14/ton (West)
|
|
Low
Differential
|
$246.93/ton (MW)
$44.37
|
$218.37/ton (MW)
$70.77
|
Pullet Cost (19 Weeks)
$4.53 JANUARY 2020 $4.13 December 2020
$3.90 (16 weeks)
VOLUMES OF PRODUCTION
|
PARAMETER
|
JANUARY 2021
|
DECEMBER 2020
|
|
Table-egg strain eggs in incubators
|
50.8 million (Jan.)
|
53.2 million (Dec.)
|
|
Pullet chicks hatched
|
26.7 million (Jan.)
|
24.0 million (Nov.)
|
|
Pullets to be housed in 5 months
|
24.1 million (May)
|
21.7 million (April)
|
|
Actual December 2020 flock
|
325.5 million
|
325.2 million*
|
|
National Flock in farms over 30,000 (2020)
|
310.3 million (Dec.)
|
309.6 million* (Nov.)
|
|
National egg-producing flock (2020)
|
326.0 million (Dec.)
|
324.6 million (Nov.)
|
|
Proportion flock in molt or post-molt
|
16.2% (Jan.)
|
17.1% (Dec.)
|
|
Total of hens in flocks over 30,000, 1st cycle (estimate)
|
272.7 million (Dec.)
|
268.5 million (Nov.)
|
* USDA Revisions
|
Total U.S. Eggs produced
|
8.34 billion (Dec.)
|
8.11* billion (Nov.)
|
|
Cage-Free hens in production
|
82.3 million (Jan.)
21.0% Organic
|
79.8 million (Dec.)
21.6% Organic
|
|
“Top-5” States hen population (USDA)1
|
155.9 million (Dec.)
|
154.9 (Nov.)
|
Note 1. Texas excluded to maintain confidentiality
PROPORTION OF U.S. TOTAL HENS BY STATE, 2020
Based on a nominal denominator of 310 million hens in flocks over 30,000 covering 95.2 percent of the U.S complement.
USDA has amended inclusion of specific states in regions and eliminated Texas data to protect confidentiality of Company flock sizes
|
STATE
|
DECEMBER ‘20
|
NOVEMBER ‘20
|
|
Iowa
|
14.9%
|
14.9%
|
|
Indiana
|
11.0%
|
11.0%
|
|
Ohio
|
10.9%
|
10.8%
|
|
Pennsylvania
|
9.3%
|
9.1%
|
|
Texas (estimate)
|
6.5% ?
|
6.5% ?
|
|
California
|
4.4%
|
4.3%
|
- Values rounded to 0.1%
Rate of Lay, weighted hen-week (USDA) 81.5% (JANUARY) 83.4% (DECEMBER)
Actual per capita egg consumption 2016:- 275.3 (up 19.8 eggs from 2015)
Actual per capita egg consumption 2017:- 282.1 (up 6.8 eggs from 2016)
Actual per capita egg consumption 2018:- 287.8 (up 5.7 eggs from 2017)
Revised per capita egg consumption 2019:- 293.6 (up 5.8 eggs from 2018)*
Projected per capita egg consumption 2020:- 285.9 (down 7.7 eggs from 2019)*
Estimated per capita egg consumption 2021:- 287.1 (up 1.2 eggs from 2020)*
*Revised, using data from USDA Livestock, Dairy and Poultry Outlook February 16th 2020 taking into account the decreased demand from the food service sector
Egg Inventories at beginning of JANUARY 2021:
Shell Eggs: 1.76 million cases down 6.8 percent from December 2020.
Frozen Egg Products: 817,375 case equivalents down 2.3 percent from December 2020
Dried Egg Products: Not disclosed since March 2020. Assume high level of inventory
Eggs broken under FSIS inspection (million cases) OCTOBER: 6.43 NOVEMBER 6.21
Cumulative eggs broken under FSIS inspection 2020 (million cases) 74.8 JAN. to DEC.
Cumulative 2020: number of cases produced (million) 268.0 JAN. to DEC.
Cumulative 2020: proportion of total eggs broken 27.9% (30.1% 2019)
EXPORTS DECEMBER 2020: (Expressed as shell-equivalent cases of 360 eggs).
|
Parameter
|
Quantity Exported
|
|
Exports:
|
|
Shell Eggs (thousand cases)
|
NOV. 329 DEC. 492
|
|
Products (thousand case equivalents)
|
NOV. 313 DEC. 386
|
|
TOTAL (thousand case equivalents)*
|
NOV. 642 DEC. 878
|
 *Representing 4.6 percent of National production in November 2020.
COMMENTARY ON JANUARY 2021 COSTS AND STATISTICS
JANUARY 2021 COST AND REVENUE DATA
The USDA reports data for six regions, respectively comprising the Northeast, South East (Mid-Atlantic), South Central, Midwest, Northwest and Northwest (NW and California combined in some tables).
From March 2019 onward some state data was withheld to maintain confidentiality where a company predominates in a specific state or region.
- The USDA ex farm benchmark blended egg price in January 2021 increased by by 33.8 percent or 19.4 cents per dozen from December 2020 to 76.8 cents per dozen, contributing to a positive margin of 6.5 cents per dozen based on ‘nest-run’ eggs (delivered from the laying house) compared to a negative margin of 10.8 cents per dozen in December. The January 2021 USDA benchmark price of 76.8 cents per dozen should be compared to 78.0 cents per dozen for the corresponding month in 2019 and 52.9 cents per dozen in January 2020.
- During January 2021, the feed component of production cost averaged 42.4 cents per dozen, up 11.8 percent from December 2020. For 2020 average feed price was 31.7 cents per dozen. The 2019 average feed cost was 31.4 cents per dozen.
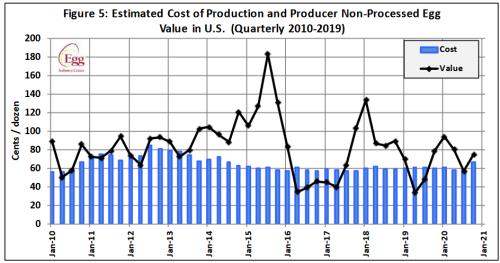
- Combining data from the USDA and the EIC, producers recorded a positive margin of 6.5 cents per dozen at farm-level, for generic-egg flocks during January 2021. This compares with a negative margin of 10.8 cents per dozen in December 2020. For 2020 the cumulative algebraic annual margin was a positive 191.8 cents per dozen. The cumulative algebraic margin for 2019 was -33.3 cents per dozen or an average monthly loss of 2.8 cents per dozen. The cumulative margin for 2018 was a positive 424.0 cents per dozen or a monthly average of 35.3 cents per dozen. The algebraic margin for 2017 was a positive 39.2 cents per dozen, with the first eight months negative comparing production cost against USDA benchmark ‘nest run’ values.
- The simple average price of feed in January 2021 over 5-regions was $265.20 per ton, 9.8 percent higher (using USDA-AMS data) corresponding to $23.72 per ton compared to December 2020. Southwest data is no longer disclosed to avoid compromising a company that predominates in Texas. The highest cost among five regions was the Northwest at $291.30 per ton. This may be compared to the lowest-cost region, the Midwest at $246.63 per ton. The average figure includes ingredients plus milling and delivery at a nominal $10 per ton.
- The benchmark price of corn was $197.20 per ton in January 2021, up $21.26 per ton or 12.1 percent higher than the December 2020 price, taking into account the difference in basis paid by producers. A 10.3 percent increase of $43.68 per ton in the price of soybean meal to $469.45 per ton in January 2021 also had a material effect on the increase in feed cost. There was a differential of $44.37 per ton in feed price between the Midwest and the Northwest compared to a difference of $70.77 per ton between the Midwest and California in December. The differential in corn price between the Midwest and the Northwest in January 2021 was $47.97 per ton ($73.01 including California in December 2020).
- Feed price will continue to be a major factor driving production cost and hence margin. Unknown factors influencing feed cost during the first and second quarters of 2021 will include uncertainty over international trade and especially exports to China, coupled with the economic and logistic effects of coronavirus restrictions. The decline in demand for crude oil and ethanol shuttered refineries in April depressing the price of corn. There is obviously some recovery in this sector with ethanol production attaining 911,080 barrels per day for the week ending February 11th. Substantial exports of corn and soybeans to China, in market year 2020/2021 beginning September 2020 have increased domestic price and hence cost of production. Each $10 per ton difference in feed cost represents approximately 1.70 cents per dozen.
- The EIC calculated the 6-Region total nest-run production cost in January 2021 to be 70.3 cents per dozen, 2.1 cents per dozen higher than in December 2020, but effectively 4.6 cents per dozen taking into account the EIC change in the value of miscellaneous costs for January 2021. Production costs during January 2021ranged from 67.1 cents per dozen in the Midwest up to 75.0 cents per dozen in the Northwest that was higher than the Midwest region by 8.0 cents per dozen.
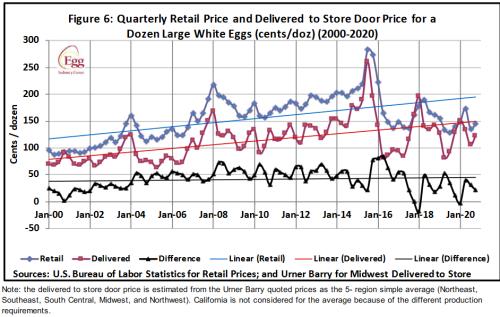
- Retail egg prices as determined by the Department of Commerce for DECEMBER 2020 averaged 148.1 cents per dozen, 3.0 cents per dozen or 2.1 percent higher than in November 2020. During December 2018 and 2019 retail prices were respectively 159.5 and 153.5 cents per dozen. Consistently since 2016 retail prices have not declined in proportion to ex-farm prices, allowing higher margins at retail, thereby depressing demand. During December retail prices increased by 3.1 cents in comparison with a 6.5 cents per dozen increase in the USDA benchmark price, demonstrating restraint in pricing possibly due to competition from deep discounters and club stores.
JANUARY 2021 PRODUCTION DATA
- According to USDA data, the estimated average complement of U.S. hens in flocks over 30,000 during December 2020 amounted to 310.3 million, reflecting a seasonal adjustment in flock size. The average total U.S. flock including hens in molt on all farms counted by the USDA amounted to 326.0 million in December 2020. The average end-of-year flock sizes over the past five years respectively were, 2012 (299 million); 2013 (308 million); 2014 (311 million); 2015 (291 million post-HPAI losses) and in 2016 (319 million). The December 2021 flock is projected to be 333.3 million, up 7.6 million or 2.1 percent from December 2020. Prevailing margins will however determine flock size in December 2021.
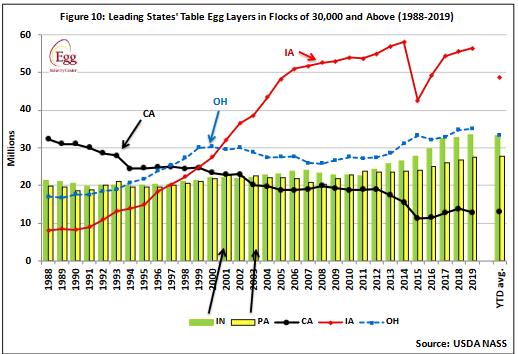
- The effect of COVID restrictions on the egg-breaking segment of the industry is noted in the decline in the flock size in Iowa. In January 2020 the state had 56.4 million hens with a progressive decline to 44.8 million in July. In December 2020 the Iowa flock attained 46.3 million hens, up 0.1 million from the previous month. Low prices and COVID-related factors have reduced hen numbers by approximately 1.5 to 2.0 million hens in each of Ohio and Pennsylvania. Hens in U.S. flocks over 30,000 declined 3.8 percent or 12.1 million hens from 322.4 million in January to a low of 299.2 million in July rising to 310.3 million in December 2020.
- Pullet chick hatch attained 24.3 million in December 2020 up 0.3 million from November. It is evident that if relatively low seasonal prices persist with further declines through the second quarter of 2021, future flock placements will be constrained by some producers cancelling pullet-chick orders.
- The total in-molt and post-molt population of hens in the 5-Regions monitored by the USDA attained 16.2 percent of the national flock in January 2021, compared to 13.5 percent in December 2020. Producers molted flocks in response to the drop in price of generic eggs following the end of the April surge in demand. Annual averages for molt and post-molt combined were 13.5 percent for 2020, 15.2 percent for 2019, 17.4 percent for 2018 and 18.0 percent in 2017. The high value of 23.8 percent in 2016 was due to the loss of hens during the 2015 HPAI epornitic.
- The average monthly projections for pullets to be transferred to laying houses during the fourth quarter of 2020 was 23.2 million and is projected at 21.9 million during the first quarter of 2021.
- The projected hatchery supply flock (parent generation) attained 3.0 million hens in December 2020. Peak parent-flock placements rose to 3.1 million hens in production in June 2015, coinciding with the end of the HPAI epornitic, to a low of 2.5 million hens during the fourth quarter of 2016. Projections show a monthly average of 3.0 million breeder hens in production during the fourth quarter of 2020 and 3.1 million in the first quarter of 2021. The size of the parent flock may be revised depending on pullet chick orders as influenced by margins.
- Average production of 81.5 percent in January 2021 compared to 83.4 percent in December 2020 reflects an older proportion of first-cycle hens and early second-cycle hens in the national flock. More pullet flocks are at or just past peak production as reflected in the availability and relatively low price of Medium-sized eggs. Average rate of lay in 2020 attained 80.9 percent compared to 79.2 percent during 2019. The average rate of lay during any period is a function of the proportion of pullets placed, the rate of depletion of flocks and retention of molted hens for a second cycle. Average flock production will fall as weighted flock age increases or conversely will rise due to early depletion thereby increasing the proportion of young hens in their first cycle.
- The January 25th USDA Poultry Slaughter Report documented 2.9 million light spent-hens processed under FSIS inspection during December, up 4.5 percent from December 2019 when hens were depleted after taking advantage of previously high prevailing prices. Spent-hens are shipped live to Canada from Northern-tier U.S. states or are rendered or composted in other regions. Approximately 14 million spent hens are disposed of each month.
DECEMBER 2020 EXPORT DATA.
- According to USDA-FAS data, 492,000 cases of shell eggs were exported in December 2020, representing 2.1 percent of total production. This value should be compared to the high value of 409,700 cases in March 2015 prior to the onset of HPAI.
- During December 2020 the following regions were the leading importers:- North America, comprising the two neighboring USMCA nations but predominantly Mexico (50.4 percent, was 43.7 percent last month). East Asia, mainly Hong Kong/China, (25.6 percent, was 41.6 percent). The Caribbean and Central American Region combined represented 9.3 percent of shell egg exports in December. (See egg export data under the STATISTICS tab)
- Exports of egg products in December 2020 attained 386,000 case-equivalents, representing 1.7 percent of U.S. output. The following regions were the leading importers of egg products by proportion of volume shipped:- North America, our USMCA neighbors (0 percent was 37.1 percent), East Asia comprising China, Japan and S. Korea (36.3 percent), Central America and the Caribbean, (3.9 percent was 8.9 percent) and the EU-27+UK (3.6 percent was 2.2 percent) represented the other significant importer of egg products from the U.S.
- Collectively, exports of shell eggs and products in December 2020 represented the output from approximately 12.7 million hens in production during the month, attaining 878,100 case-equivalents, up a noteworthy 36.7 percent from November 2020. This was 24.6 percent lower compared to monthly average shipments of 960,000 case-equivalents exported over the first four months of 2015 prior to the advent of HPAI, indicating that international markets are being regained.
Maintaining export volume is attributed to cooperation between the AEB and USAPEEC, both in existing and new markets. Specific attention is directed to nations with the potential to import U.S. product based on landed price against competition. Exports of both egg-products and shell eggs in December 2020 corresponded to 4.6 percent of a nominal national flock of approximately 310 million hens in production on commercial farms holding more than 30,000 hens.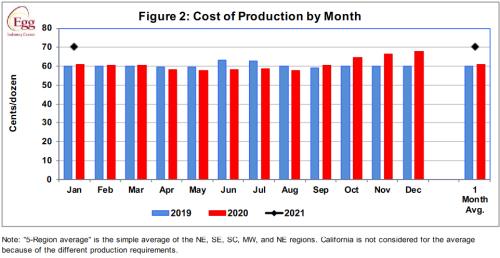
- There is no scientifically justifiable reason why any nation should embargo pasteurized egg products from an approved plant, based on a diagnoses of avian influenza or END in a state or country.