 In a January 11th release, Albertsons Companies (ACI) posted financial results for the third quarter of fiscal 2022 ending December 4th 2021. This Company can be regarded as a bellwether for the retail food industry subject to increased costs of ingredients, labor, packaging and transport in a competitive consumer environment still restrained by COVID.
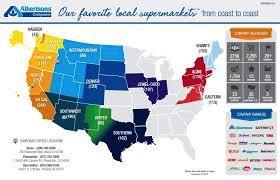
Albertsons operates 21 banners including Albertsons, Safeway, Von’s, Acme, Jewel-Osco and Shaw’s.
For the period, net revenue was $424.5 million on total revenue of $16,728 million. Comparable figures for the third quarter of fiscal 2021 ending December 5th 2020 were net income of $123.7 million on total revenue of $15,409 million. EPS rose from $0.20 for the third quarter of fiscal 2021 to $0.77 for the most recent quarter. Gross margin declined from 29.2 percent to 28.8 percent denoting escalation in cost of goods sold due to inflation.
 In commenting on Q3 results Vivek Sankaran stated, CEO "We are pleased with our third quarter results as we continue to execute against our transformation strategy. A favorable economic backdrop together with the heroic performance of our frontline retail, distribution, and manufacturing teams contributed to these better-than-expected results," He added "Also driving these results was our continued focus on in-store excellence, acceleration of our digital and omnichannel capabilities, and delivery of our productivity initiatives. During the quarter, we continued to gain market share in both units and dollars and saw ongoing improvement in both the in-store and online customer experience."
Albertsons Companies posted assets of $27,936 million, against long-term debt and lease obligations of $15,880 million. The Company had an intraday market capitalization of $14,340 million on January 14th. ACI trades with a forward P/E of 12.0 and has ranged over a 52-week period from $15.97 to $37.85 with a 50-day moving average of $37.44. Twelve-month trailing operating margin was 3.2 percent and profit margin 1.5 percent. Return on assets over the past twelve months was 5.1 percent and the return on equity 29.6 percent. At close of trading January 11th pre-release, ACI was priced at $28.79. At market close, post-release on January 12th ACI traded at at $29.63 up 2.9 percent.